
|
|
|---|
|
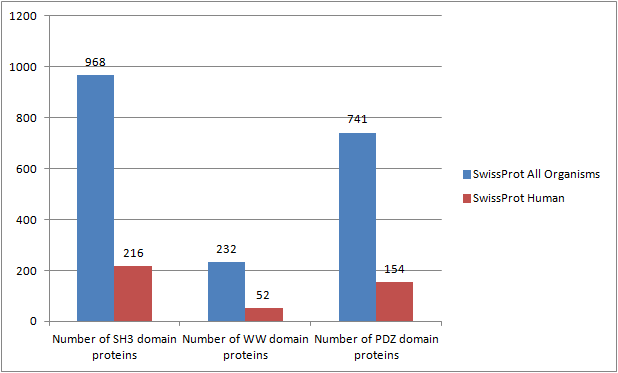
Linear Motif Domain Interaction Prediction, abbreviated as "LMDIPred", is a web server that detects the occurrence of peptides conforming to linear motifs mediating Protein-Protein Interactions (PPIs) with SH3, WW and PDZ domains, in user-provided amino-acid sequence(s). ( Sarkar et al. PLoS One. 2018. doi: 10.1371/journal.pone.0200430.) A comparison of the total number of SwissProt proteins that are known to contain these three domains from all organisms and only humans (as on July 10, 2017) is shown in the following figure:
Datasets: Download LMDIPred Positive datasets: Negative dataset.A set of 3960 fasta-formatted protein sequences [3192 from Oryza sativa subsp. japonica (short-grained Asian rice), 400 from Solanum tuberosum (potato), and 368 from Triticum aestivum (common wheat)] were downloaded from UniProtKB/Swiss-Prot, the manually annotated section of the UniProt KnowledgeBase. Perl scripts were used to extract 6-residue (for SH3 & WW) and 4-residue (for PDZ) long peptides from random positions within these sequences, and a set of 120 such random peptides were used as negative training examples for each class of peptide ligands. Download Negative dataset: Random peptide Instances Independent dataset.The indepedent dataset was composed of 62 experimentally validated PDZ-binding 10-mer mouse peptides from Stiffler et al [PubMed ID: 17641200], and 25 experimentally validated SH3-binding yeast peptides of variable length from Tonikian et al [PubMed ID: 19841731]. Download Independent datasets: Table 1: Overview of the datasets for each class of ligand motifs :
Table 3A: Performance of different prediction methods in 5-fold cross-validation for the SH3 domain binding peptides :
Table 3B: Performance of different prediction methods in 5-fold cross-validation for the WW domain binding peptides :
Table 3C: Performance of different prediction methods in 5-fold cross-validation for the PDZ domain binding peptides :
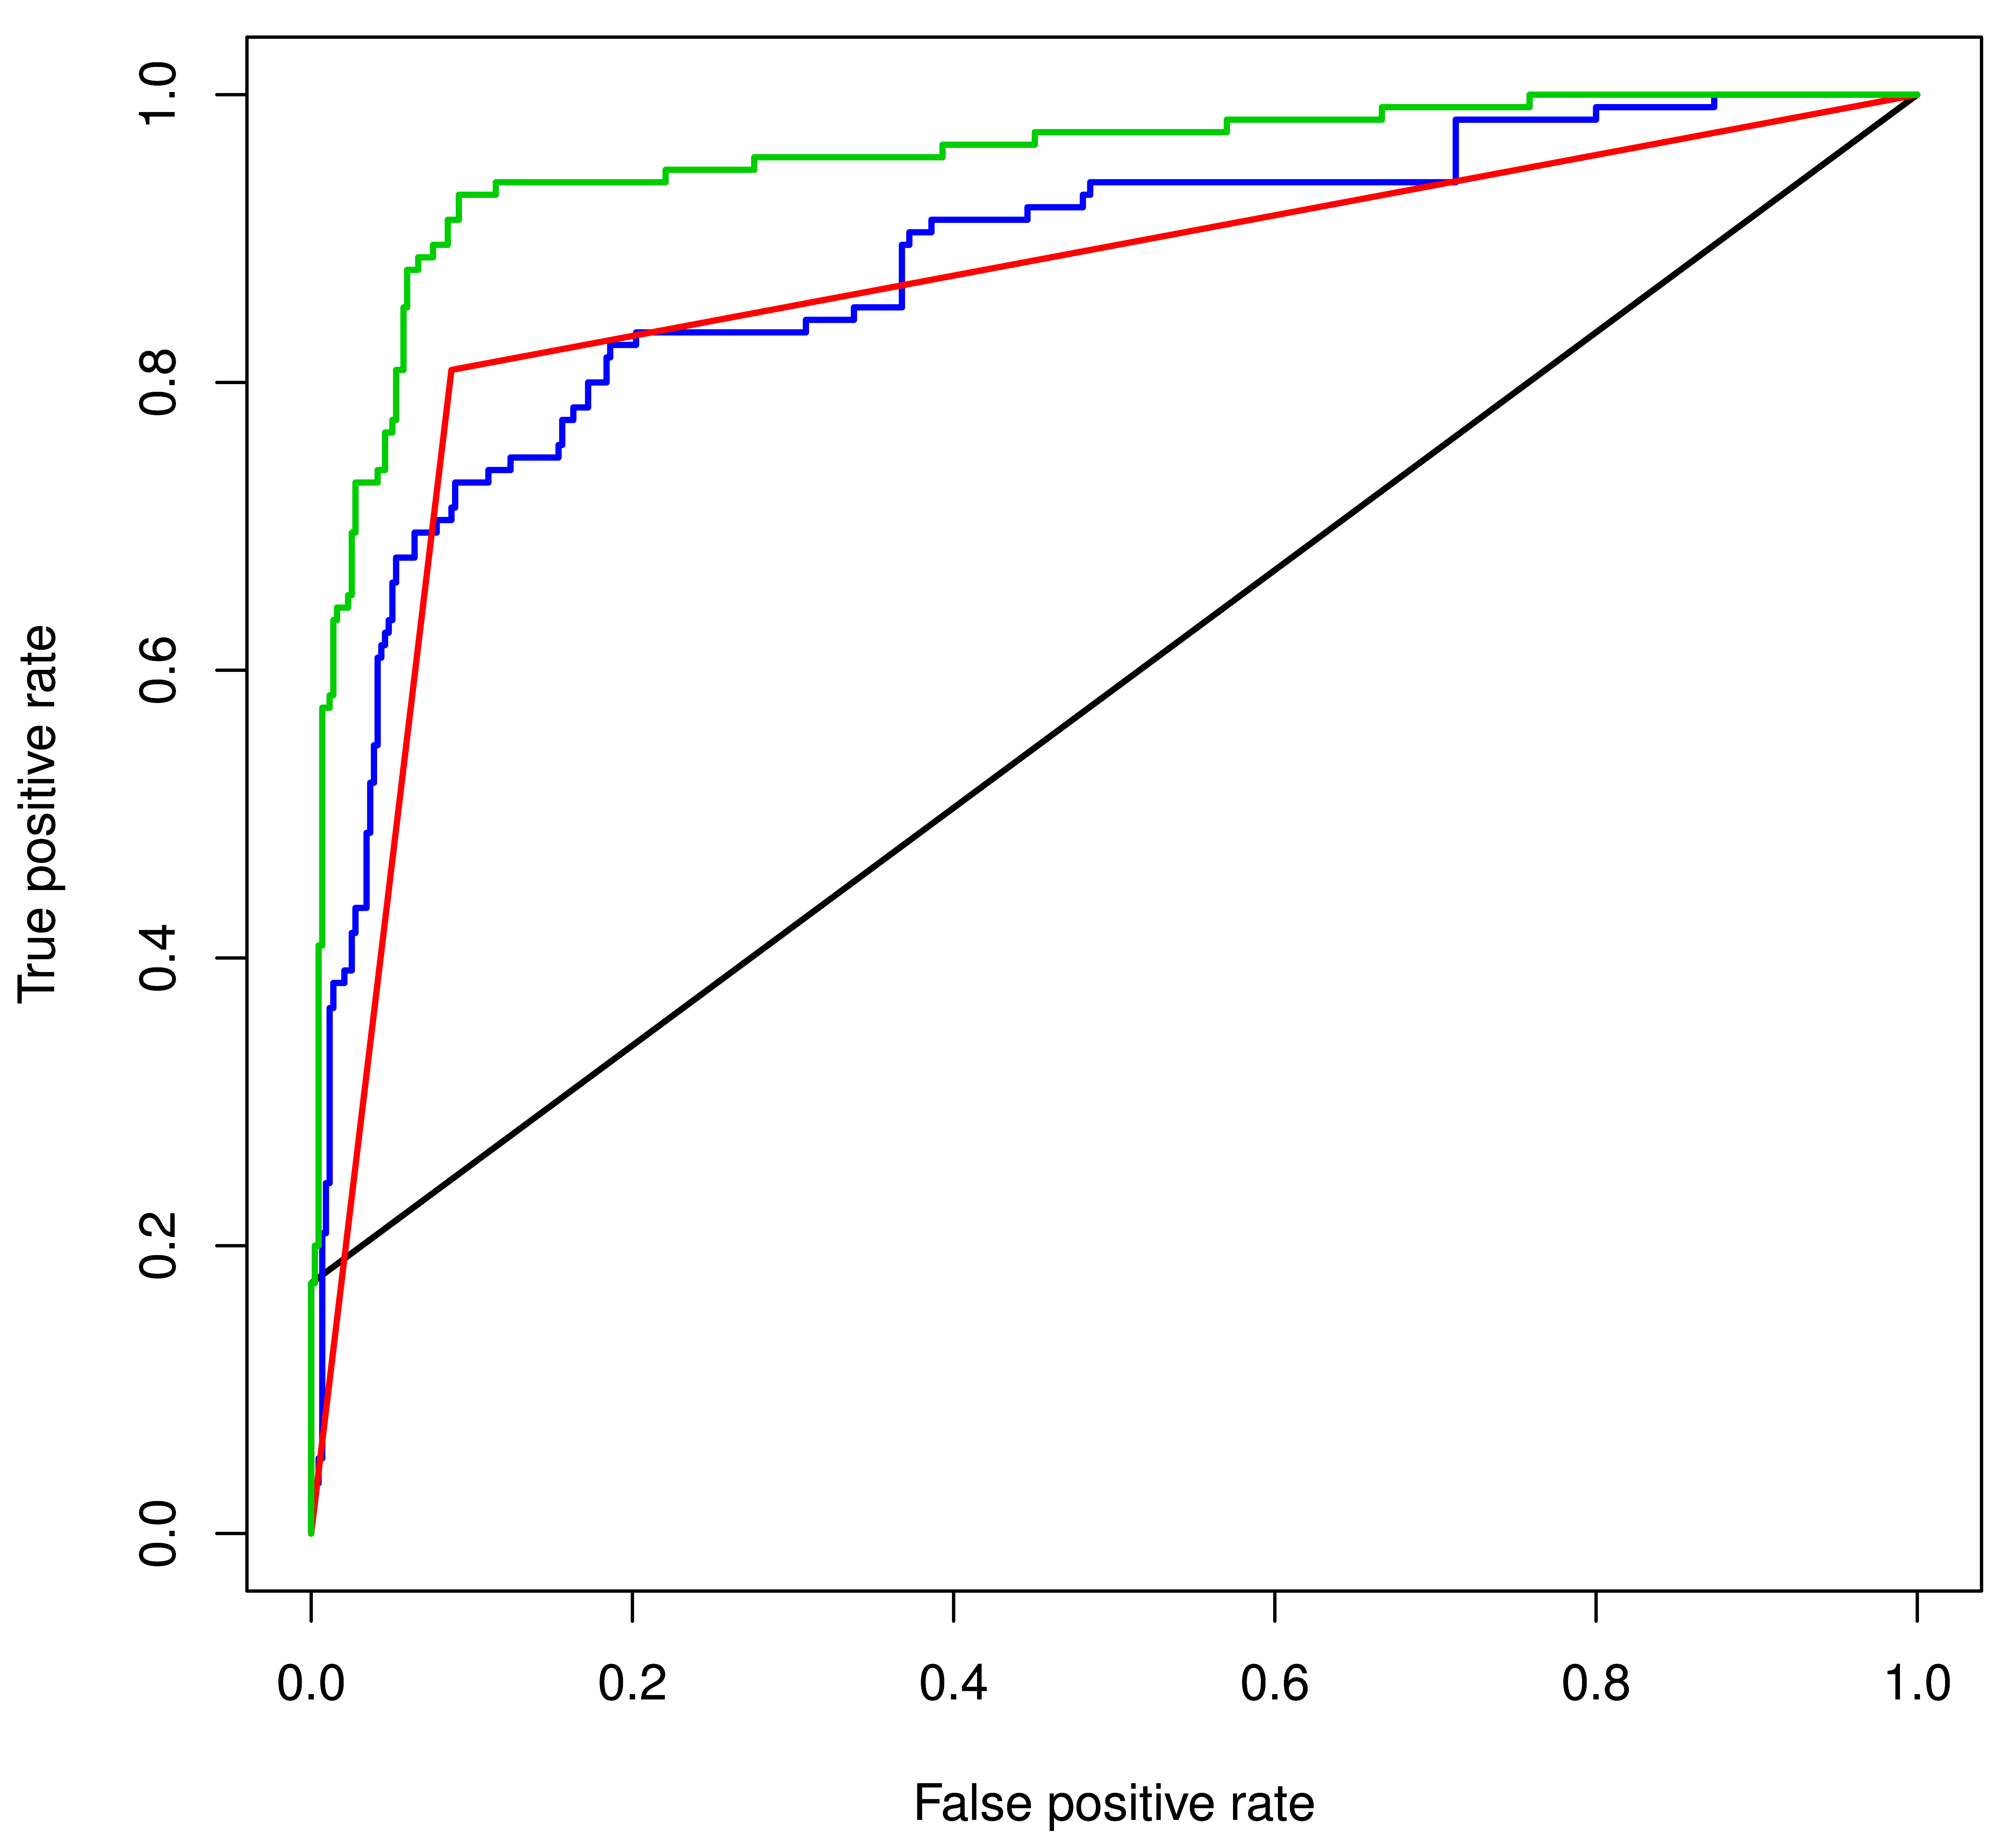
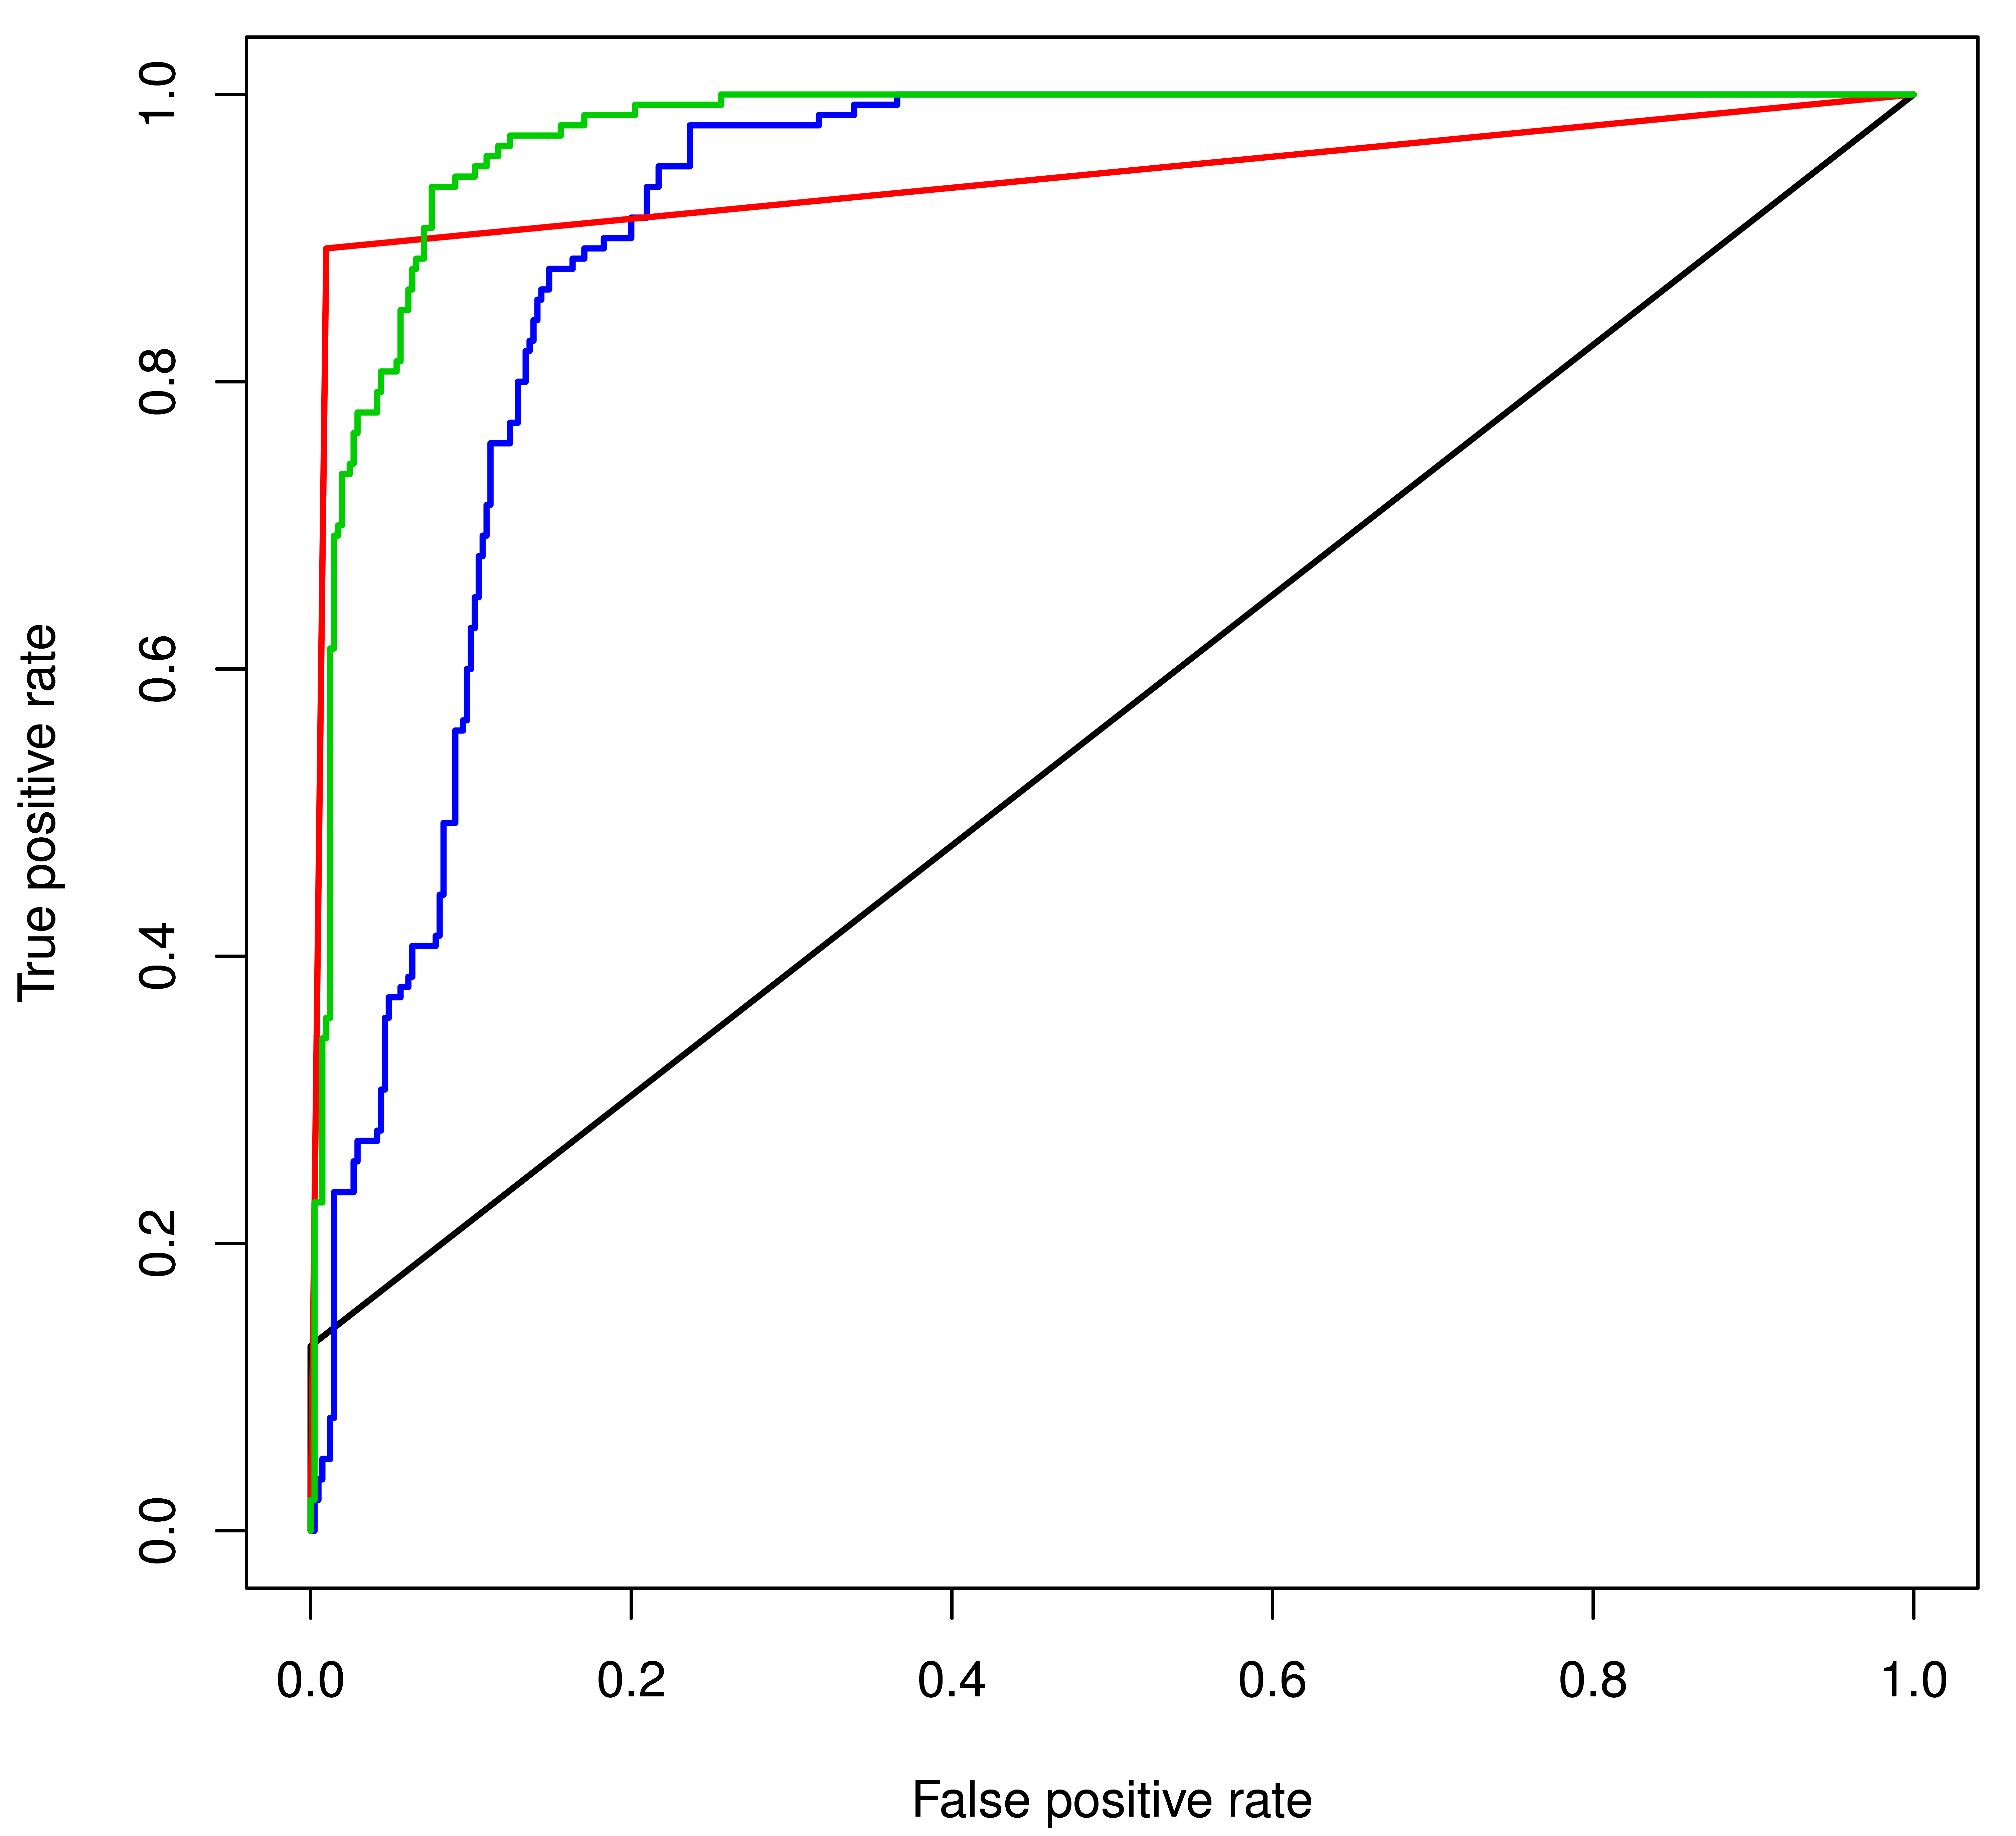
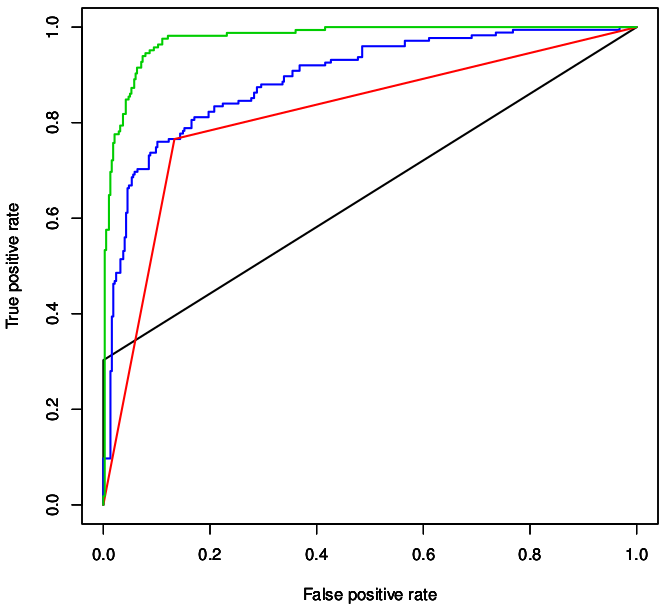
Table 3: ROC plots of different prediction methods for different datasets : [Green (SVM Prediction), Blue (PSSM Scanning), Black (Motif Instance Matching) and Red (Regular Expression Scanning). ROC plots for MIM and RES methods appear as smooth flat lines when compared to the plots for SVM and PSSM, because SVM and PSSM outputs comprise of continuous scores, while the MIM and RES produce discrete outcomes, one or zero (either “match” or “mismatch”)]
|