

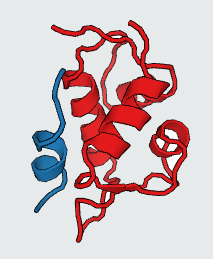
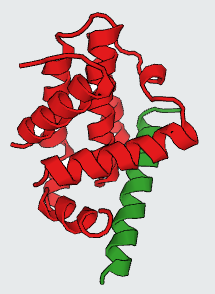
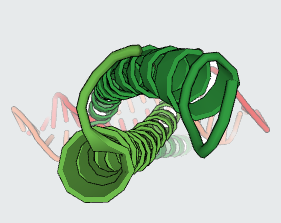
Protein-Protein Interactions (PPIs) which have a vital role in many cellular processes, can be inhibited by small synthetic molecules at hotspot of PPIs. Those small molecules are called Protein-Protein Interaction Modulators (PPIMs). Therefore, we built a web based prediction server named as Prediction of Protein-Protein Interaction Modulators (PPIMpred) which may complement High-throughput Docking studies using small chemicals. This webserver can perform faster with better accuracy to indentify the ligands on target PPIs using support vector machine (SVM) based method and similarity search algorithm (Tanimoto Co-efficient). Here three popular PPIs were studied : i) Mdm2/P53 ii) Bcl2/bak and and iii) c-Myc/Max.
Datasets:
Cross-validation dataset: The data of distinct small molecules (inhibitors) for three PPIs: Mdm2/P53, Bcl2/Bak, and c-Myc/Max were downloaded from TIMBAL and PubChem databases. The positive datasets of Mdm2/P53, Bcl2/Bak, and c-Myc/Max consisted of 250, 735 and 15 small molecules respectively. No two small molecules have 100% similarity, based on PubChem BioAssay structure clustering. To see structure clustering of Mdm2/P53, click here. In case of Mdm2/P53 and Bcl2/Bak the negative sets were prepared by choosing 1040 random chemicals from PubChem and adding the other two positive set of PPIMs. For example, Bcl2/Bak and c-Myc/Max positive sets were included in Mdm2/P53 negative set along with 1040 random chemicals. In a case of c-Myc/Max there were only 15 positive PPIMs, so we selected ten times of positive set from random small chemicals as a negative set. Therefore, the negative datasets of three PPIs (Mdm2/P53, Bcl2/Bak, and c-Myc/Max) became 1790, 1305 and 150 molecules respectively. The positive and negative sets were further divided into five equal parts for training/testing purpose in five-fold cross validation technique.
- Blind dataset: The positive blind sets for Mdm2/P53, Bcl2/Bak, and c-Myc/Max were 30, 100 and 5 PPIMs respectively obtained from TIMBAL, which were not used in training and testing. The negative blind sets were created in two subsets for each PPI complex, i.e., 1:1 (P : N) and 1:10 (P : N) randomly from PubChem.
- Independent (large) dataset: National Cancer Institute (NCI) database released as on May 2012 consisting of 265,242 structures were processed and finally 216,103 structures were used as a large independent dataset. The structures that did not have xlogP3 value were removed.
- 2P2I database: It is positive dataset that has 40 PPIMs were included in our study.
| Training/Testing Dataset | ||
| TARGET PPI | POSITIVE | NEGATIVE |
| Mdm2/P53 | Mdm2/P53 Training Positive Data | Mdm2/P53 Training Negative Data | Bcl2/Bak | Bcl2/Bak Training Positive Data | Bcl2/BakTraining Negative Data |
| c-Myc/Max | c-Myc/Max Training Positive Data | c-Myc/Max Training Negative Data |
| Independent/blind Dataset | |||
| TARGET PPI | POSITIVE | NEGATIVE I | NEGATIVE II |
| Mdm2/P53 | Mdm2/P53 Training Positive Independent Data | Mdm2/P53 Training NEGATIVE I Independent Data | Mdm2/P53 Training NEGATIVE II Independent Data |
| Bcl2/Bak | Bcl2/BakTraining Positive Independent Data | Bcl2/BakTraining NEGATIVE I Independent Data | Bcl2/BakTraining NEGATIVE II Independent Data |
| c-Myc/Max | c-Myc/MaxTraining Positive Independent Data | c-Myc/Max Training NEGATIVE I Independent Data | c-Myc/Max Training NEGATIVE II Independent Data |
Methods:
- SVM based Method:
- Feature Selection: We have manually collected physico-chemical properties of both positive and negative examples of each targets. Initially 18 descriptors of each chemicals both chemicals were sorted by chemical ID and chemical and duplicates were removed. Feature selectction by HCA and T-test were done. Finally 10 descriptors were selected. Those are i) Molecular Weight, ii) XLogP3, iii)Hydrogen Bond Donor Count, iv) Rotatable Bond Count, v) Topological Polar Surface Area, vi) Heavy Atom Count, vii) Complexity, viii) Defined Atom Stereocenter Count, ix) Defined Bond Stereocenter Count and x) Covalently-Bonded Unit Count.
- Missing Value: We replaced the value by taking its average value where the value of columns (descriptors) were missed.
- Kernel Selection: We used three different kernel while learning SVM model for each target PPIs. Those three kernels are: a) Linear, b) Polynomial and c) RBF kernel.
- 5 fold cross validation: Positive and negative datasets on three different targets are divided into 5 parts respectively. Then we trained and tested datasets in 5 fold cross validation and the results were calculated.
- Naïve Bayes & Random Forest: The two other machine learning techniques including Naïve Bayes method and Random Forest was used in this study by Weka tool.
- Similarity Based Method: In this webserver we included similarity searching method to find more similar chemicals against users query input (drawn structure or mol file). For building up this method we used ChemmineR package. In the package there is a function cmp.similarity function computes the atom pair similarity between two compounds using the Tanimoto coefficient as similarity measure. The coefficient is defined as c/(a+b+c), which is the proportion of the atom pairs shared among two compounds divided by their union. The variable c is the number of atom pairs common in both compounds, while a and b are the numbers of their unique atom pairs. The function returns a data frame where the rows are sorted by the Tanimoto similarity score (best to worst).
- Docking Studies:
The predicted top PPIMs for all the three PPI complexes (Mdm2/P53, Bcl2/Bak, c-Myc/Max) were further used for in silico docking by AutoDock Vina tool. The PDB ID of three PPIs are as follows:
If we plot a histogram, then frequency density of over all data points is ((F/W)*N) where N is the number of datapoints, F is the frequency and W is the bandwidth of the frequency F. Then Area under curve(AUC) value will be 1.
In our proposed mathematical model, we plot negative and positive both relative frequency plot. After that we calculated confidence measures both graph respectively. If Vscore is SVM score and X random is the random variable score (i.e. score comes after SVM prediction hits). Then we measure probability random variable over the SVM score (i.e is SVM score of both positive and negative) in terms of Positiveness and Negativeness.
- Positiveness: Positiveness means probable chance to be positive. Probabilty P ( X random > Vscore ) represents in the following figure left shaded blue as "Positiveness Area" from the prediction point (i.e. X random point).
- Negativeness:Negativeness means probable chance to be Negative. Probabilty P ( X random < Vscore ) represent in the following figure right shaded blue as "Negativeness Area" from the prediction point (i.e. X random point).
Results: In summary, after the 5 fold cross validation we get results for three different target PPIs MDM2/P53, c-MYC/MAX and BCL2/BAK that given below in tabular format.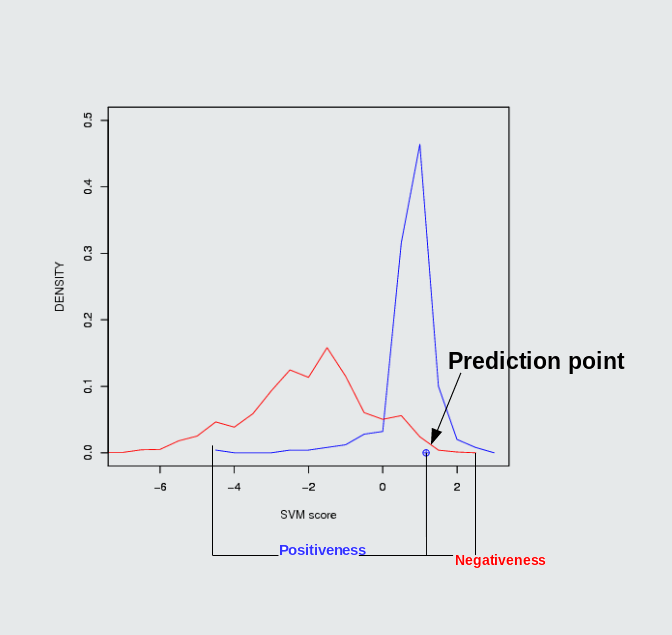
fig.1 Density plot of CID 11433190 which can inhibit Mdm2/P53 PPI and its positiveness: 52.14 & negativeness: 23.27
Target PPI Sensitivity Specficity Accuracy PPV F1 AUC Mdm2/P53 0.83 0.82 0.83 0.45 0.57 0.88 RBF kernel Bcl2/Bak 0.86 0.75 0.79 0.72 0.77 0.83 RBF kernel c-Myc/Max 0.87 0.91 0.90 0.50 0.63 0.91 RBF kernel
Mdm2/P53
Bcl2/Bak
c-Myc/Max
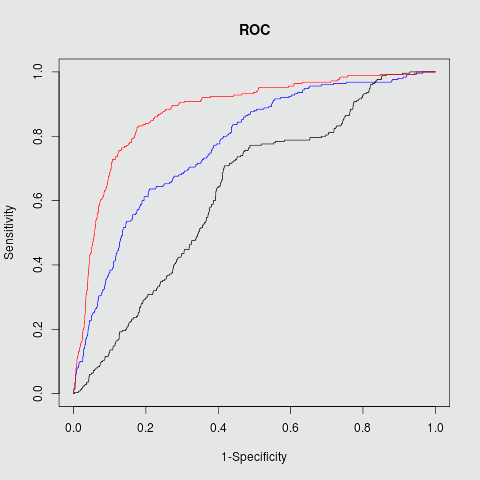
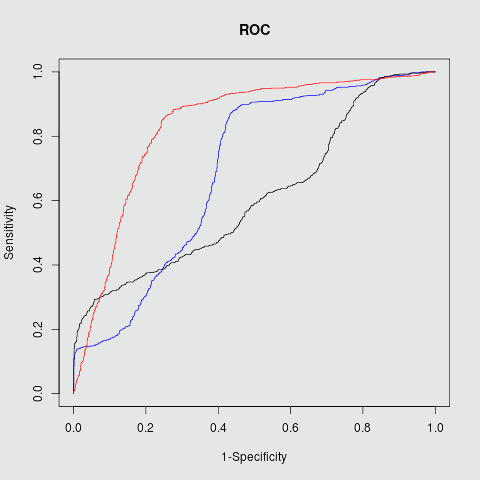
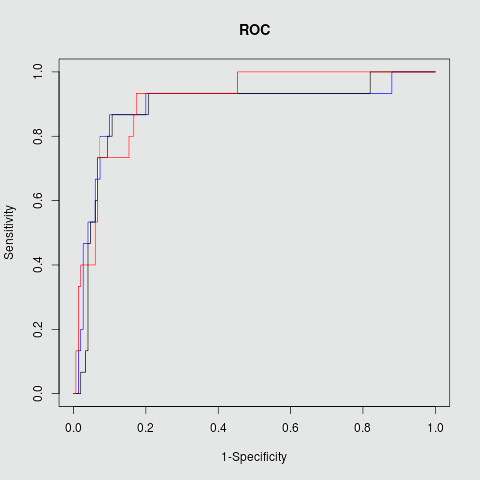
Fig.2 ROC plots in three different targets Mdm2/P53, Bcl2/BAK and c-Myc/Max
Result of known PPIMs:
There are some well known PPIMs which were clinically tested. Such as Nutlin 3a, ABT-263 and GX15-070 etc. Those were evaluted by our SVM based models. The ouput of those PPIMs are tabulated here.Users input chemical/ (CID) Target protein-protein interaction complex Result of prediction SVM score Positiveness Negativeness Nutlin 3a (11433190) Mdm2/P53 positive PPIM 1.17 52.14% 23.27% ABT-263 Bcl2/Bak positive PPIM 1.01 42.86 3.46 GX15-070 Bcl2/Bak positive PPIM 0.56 17.02% 13.27% 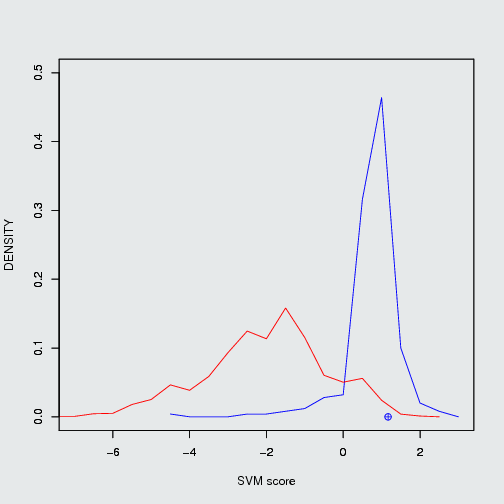
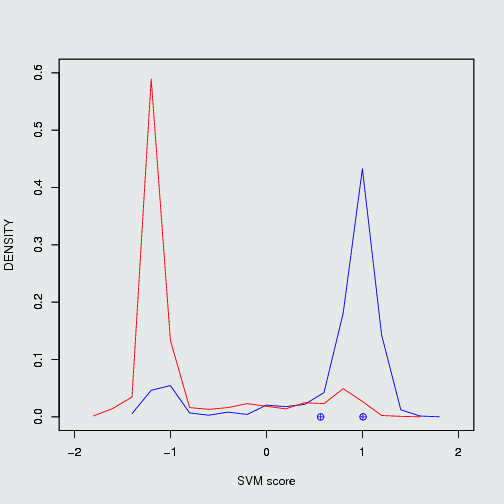
Position of Nutlin 3a in frequency density plot of Mdm2/P53. Position of ABT-263 & GX15-070 in frequency density plot of Bcl2/Bak
Conclusion : In summary, PPIMpred can be useful for high throughput screening of small chemicals and besides categorical classification it also give hints of structural similarity with known drug like molecules for further insights.
Cite this article:
Jana T, Ghosh A, Das Mandal S, Banerjee R, Saha S. 2017 PPIMpred:a web server for high-throughput screening of small molecules targeting protein–protein interaction.R. Soc. open sci.4: 160501. http://dx.doi.org/10.1098/rsos.1605 PUBMED: 28484602