|
Browse the cancer stem cell biomarker genes in alphabetical order
Browse the clinical biomarkers for each cancer type
Browse the cell line specific biomarkers for each cancer type
Browse the Lung cancer cell lines
Browse the Breast cancer cell lines
Browse the Colon cancer cell lines
Browse the Hepatic cancer cell lines
Browse the Skin cancer cell lines
Browse the Head and Neck cancer cell lines
Browse the Pancreatic cancer cell lines
Browse the Glioblastoma cancer cell lines
Browse the Gastric cancer cell lines
Browse the Bladder cancer cell lines
Browse the therapeutic targets in alphabetical order
Browse the interaction networks specific to cell lines
The interaction legends
Node Attributes:
Node color denotes the expression level of the target biomarker/gene for example
 | Red color of node signify upregulated expression of target gene |
 | Green color of node signify downregulated expression of target gene |
 | Grey color of node signify data not available of target gene |
Edge Attributes:
Edge colour denotes the type of interaction between the nodes
Edge Shape denotes the expression level of the target gene or node
 | Green edge colour signifies miRNA-mRNA interaction | 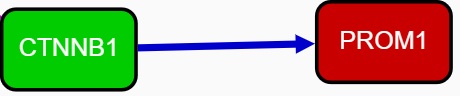 | Arrow shape indicates upregulated expression of target gene |
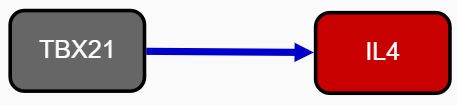 | Blue edge colour signifies Protein-Gene interaction | 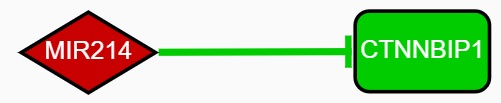 | T-shape indicates downregulated expression of target gene |
 | Pink edge colour signifies Protein-Protein interaction | 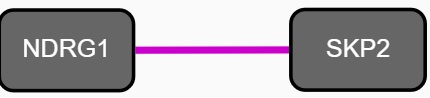 | Straight line indicates unchanged expression of target gene |
 | Red edge colour signifies RNA-Protein interaction |
|